
Note: Please Open Site on Desktop For Best Results
UltraSonic:
Ultrasound Skin Deformation Diagnoses
Eliminating Uncertainty Under the Surface
Project Description
The motivation for this code is to provide a quantitative method for clinicians to determine the progression of skin diseases and their treatments, as there is no such quantitative method currently available.
01
Plot
The first step in this process is having the user select a region of interest in the ultrasound video to track. The program then takes this region of interest and turns it into a matrix of points which the program will track.
02
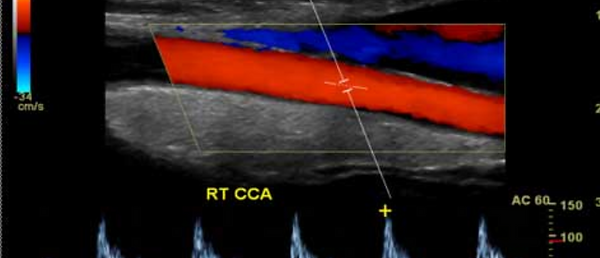
Track
The next step is to track the motion of the plotted points as the skin moves due to a known applied force from one frame to the next in the video. This is done using functions in OpenCV, a library of functions designed for real time computer vision.
03
Calculate
The final step is to calculate meaningful data that can be used by the clinician such as strain. This is done by taking the tracked distance that the points moved and using it to calculate strain, then plotting the strain field to locate areas of high and low strain.


Meet UltraSonic

Jake Catalano
Jake is a senior Mechanical Engineering student. He is also pursuing his Master's Degree in Mechanical Engineering with concentrations in medical devices and manufacturing. He is the captain of the Stevens cross country and track & field teams. In addition, he is a member of the Pi Tau Sigma honor society.

Mark Anthony Demetillo
Mark Anthony is currently a senior Mechanical Engineering student and is planning to obtain his Master's of Engineering in Mechanical Engineering concentrated in Pharmaceutical Manufacturing. In addition to being a Pinnacle Scholar and Society of Military Engineers (SAME) Scholar, Mark Anthony is a proud member of the Pi Tau Sigma and Tau Beta Pi honor societies. Some of his previous work experience includes automation of graphene exfoliation and generating anatomically-accurate brain and brain structure models to investigate cerebral atrophy.

Jack Moss
Jack is currently a 4/4 Mechanical Engineering student, pursuing a career path in the medical device industry. Jack is also the Vice President of Tau Beta Pi New Jersey Alpha chapter engineering honor society, as well as, a brother of Pi Tau Sigma Mechanical Engineering Honor society.

Richard Rossbach
Richard is a senior Mechanical Engineering student. He is also pursuing a Master's Degree in Mechanical Engineering with a concentration in medical devices. He is a member of the Tau Beta Pi Honor Society and is a Pinnacle Scholar.
Chenxin Xu
Chenxin is a senior Mechanical Engineering student. She did study abroad at the University of New South Wales, Sydney, Australia. She will continue to pursue a Master's Degree after graduation.

Johannes Weickenmeier, PhD
Prof. Johannes Weickenmeier is the adivsor for this project and he completed his PhD at the Swiss Federal Institute of Technology in Zurich in 2015 and worked as a postdoc in the group of Prof. Ellen Kuhl at Stanford University. His research includes the experimental and computational characterization of soft tissues with a specific interest in the skin and brain. His current work focuses on our fundamental understanding of mechanobiological properties and mechanisms in the healthy and aging brain, as well as coupled multi-field formulations for the spread of neurodegenerative diseases, such as in Alzheimer’s disease and chronic traumatic encephalopathy.

Concept Design and Selection
Concept 1: Tracking Set Key Points


User-specified points or regions of interest are tracked and deformation of each point is calculated, reporting changes through color variation.
Concept 2: Algorithm-Generated Key Point Tracking

Computer vision is used to automatically generate points to track based on characteristics of the video being analyzed.
Concept 3: Dense Optical Flow
Motion of every pixel in the frame of the video is tracked and vector fields representing movement are drawn.
Concept 4: Color Hue Tracking
Moving points on the ultrasound are colored based on flow towards or away from a transducer.
Concept 5: Electrical Signal Measurements Via Electrode Pads

Current measurements from applied voltages are taken of deformed and undeformed skin and signals can be generated on the ultrasound to report strain.
Concept Selection

Technical Analysis and Design
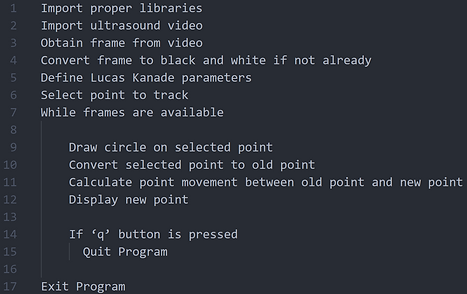
Pseudo Code for One Point Tracking
Pseudo Code for ROI Tracking

As shown in the figures above, pseudo code demonstrates the plan of action to be executed in layman's terms. Indentations demonstrate functions to be executed within loops (while loops, for loops, etc.).
Strain
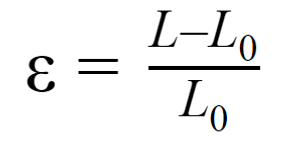
From the deformation outputted by the software, strain fields can be generated as long as the initial length of the measured area is known. From the strain fields, doctors will be able to make conclusions about the skin's heath.
Control Flow/Block Diagram

Block Diagrams are a great way to show how a code will flow through its operations. UltraSonic's code begins with uploading a video or image file and then allowing a physician to select the area to be analyzed. The option of then determining how many points are to be tracked is given, and from the selected region, those points will be made. Next, the code will track the points frame by frame, and a vector field showing the deformation and progress of the points is created. Operators will then be given the option to look at their results and decide if they would like to continue with the calculations, plot new points, or redo the analysis with more points for greater detailed analyses. The code will then plot the deformation, read out important stress and strain values, and give the physician its determination on whether the skin is healthy or not.
Program Time Complexity
The time complexity of the program can be described using something known as Big-O notation, which is a measure of how much time or space an algorithm is going to take. As our program is based off of the Lucas-Kanade algorithm for optical flow, the time complexity should be near identical. This complexity is well documented and can be seen below, the steps refer to each step of the Lucas-Kanade algorithm. The total Big-O expression for each iteration is O(n^(2)*N+n^3). This means that the time the program takes increases cubically depending on the size of the input, and increases squared with respect to the number of iterations of the algorithm. In the function, n refers to the number of warp parameters, while N is the number of pixels. However, N is characteristically much larger than n (N>>n), so the time complexity function simplifies down to O(n^(2)*N).

Project Management
UltraSonic strives to provide a quality product for its customers. To do this a strict schedule and budget is followed to ensure the best possible software.
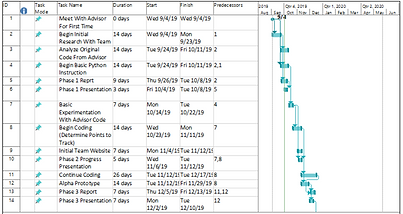

Scheduling helps us at UltraSonic remain on schedule for the launch of our new software. Milestones are set to help the team stay focused and determined in meeting our deadlines. The three main milestones include deadlines for plotting the key points to be tracked (November 11th), tracking the key points in time for the alpha prototype (November 29th), and calculating the strain from the data (March 31st). The completed and refined code will then be showcased at the Stevens Innovation Expo in May of 2020. Several other update reports and presentations are also worked into our schedule to keep the public updated on the project. Updates will also be posted in the "Progress and Updates" page on our website. The images above show the Phase 1-3 Gantt Chart (left) and the updated Phase 4-6 Gantt Chart (right) due to the COVID-19 pandemic.

Keeping a budget helps our team monitor its spending and remain on track to complete our product. Failing to follow the budget can result in delays and unforeseen issues not accounted for in our schedule.The team has remained in the budget of $700 as no purchases needed to be made due to the software based nature of the project. The budget including the bill of materials can be seen to the left.